Benthic dive 1999281
(Ship & ROV tracks, ROV line colored by Oxygen, 800m terrain):
Yellow line indicates a low oxygen zone at the shoulder of a small 50m embankment.
Midwater dive 1999084,
default selections for 3D replay (Ship & ROV tracks, ROV line colored by Oxygen):
Easy to visualize the midwater transects and the low oxygen zone. The white lines
show the horizontal and verical scale. The vertical line is 4 times longer than the
horizontal because we have 4x vertical exaggeration.
Same dive with terrain (ROV located about 32 minutes earlier in the dive):
Same dive, 12 minutes later than upper image, zoomed into with 50m of ventana.
Early screen grab taken before time added to slider and color added to track lines. It shows the use of transparent terrain. This is from Expedition 1999273:
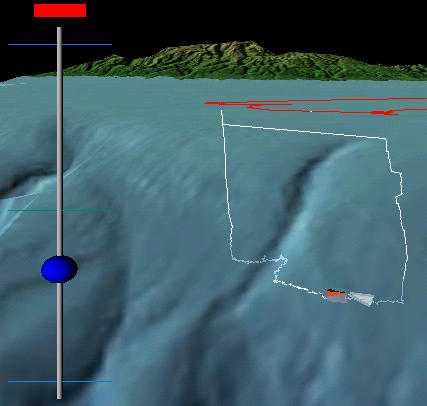 Sample screen shot from R/V Point Lobos expedition on 1999273 (Ventana dive #1684). Terrain is shown with 25% transparency, notice how you can see the ROV model and dive track go below the surface. The vertical bar on the left is a time-control slider. You can click and drag the blue ball to control the positions of the ship and the ROV according to the navigation records. The red rectangle on top of the slider control can be clicked to turn on and off the replay. When it's on it will be green and the Ship and ROV models will move along their tracks at a normal (un-accelerated) speed. All of these visualizations are generated with a 4X vertical exaggeration. |